Plain-language overview
Statistics help researchers decide how much confidence to place in a clinical-trial result and how much uncertainty remains. They do not turn a weak study into a strong one, and they do not tell us by themselves whether a treatment effect is important to patients. [1-8]
A result can be statistically significant but too small to matter clinically. A result can also fail to reach statistical significance because the study was too small or imprecise, even though an important benefit or harm is still possible. Good interpretation therefore looks at the size of the effect, the uncertainty around it, the study design, and the clinical meaning—not just whether a p value crosses a particular cutoff. [1-8]
Sample size
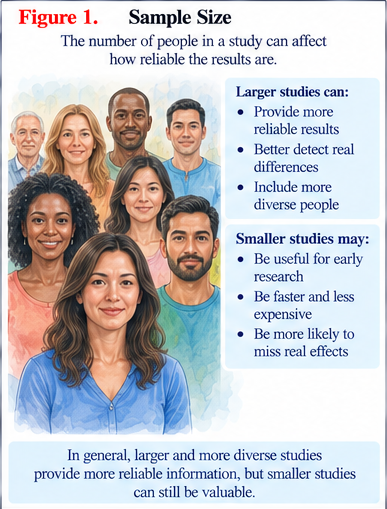
Sample size is the number of people or observations included in a study. Researchers usually estimate in advance how many participants are needed to answer the main study question with useful precision. [1-8]
A study that is too small may miss a real and important effect or produce an estimate with a wide range of uncertainty. A very large study can detect tiny differences that are statistically real but not important in everyday life. [1-8]
Statistical power
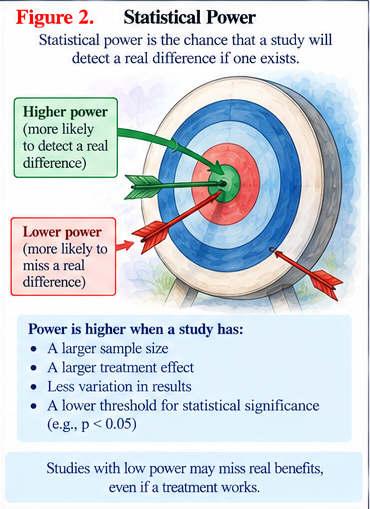
Statistical power describes a study's ability, under its planning assumptions, to detect a specified effect if that effect truly exists. Larger samples, larger effects, lower variability, and more outcome events generally increase power. [1-8]
A low-powered study is more likely to miss the effect it was designed to detect. However, once a trial is complete, the actual effect estimate and its confidence interval usually tell us more than calculating 'observed power' from the final result. [1-8]
Confidence intervals
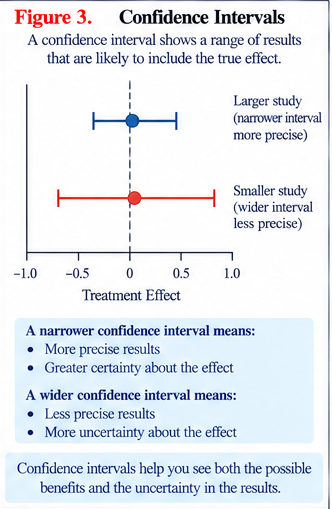
A confidence interval gives a range around the estimated treatment effect and helps show how precise or uncertain that estimate is. Narrow intervals usually mean greater precision; wide intervals mean more uncertainty. [1-8]
The interval should be compared with effects that would matter clinically. A study may be statistically significant while the entire interval contains only very small benefits. Another study may not be statistically significant but have such a wide interval that meaningful benefit and meaningful harm are both still possible. [1-8]
Multiple comparisons
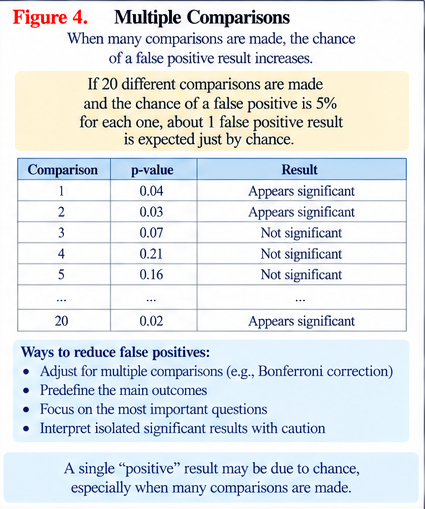
Multiple comparisons occur when researchers test many outcomes, doses, time points, or subgroups. The more statistical tests that are performed, the greater the chance that at least one apparently positive result will occur simply by chance. [1-8]
Researchers can reduce this problem by deciding the main outcomes and testing strategy before looking at the results. Exploratory analyses can still be valuable, but unexpected positive findings should usually be treated as ideas to test again rather than as final proof. [1-8]
Missing data
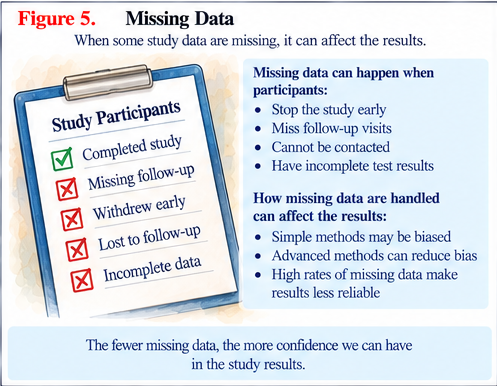
Missing data occur when planned information is unavailable—for example because someone leaves the study, misses a visit, stops treatment, dies, or does not complete a questionnaire. [1-8]
Missing information can bias a result, especially if the reasons for missing data differ between treatment groups or are related to how well a patient is doing. Researchers should try to prevent missing data, explain why it occurred, use appropriate statistical methods, and test whether different reasonable assumptions change the conclusion. [1-8]
Subgroup analysis
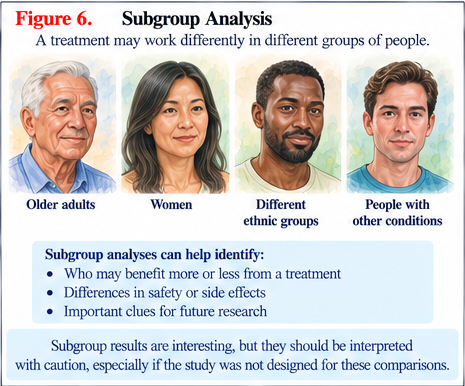
Subgroup analysis asks whether a treatment appears to work differently in particular groups, such as younger and older patients, people with different disease severity, or people who have or have not received previous treatment. [1-8]
Subgroup findings can be useful but are easy to overinterpret. Small groups and many comparisons can create apparent differences by chance. Stronger subgroup evidence comes from a question planned in advance, enough participants, an appropriate statistical test, a plausible reason for the difference, and confirmation in other studies. [1-8]
Intention-to-treat analysis
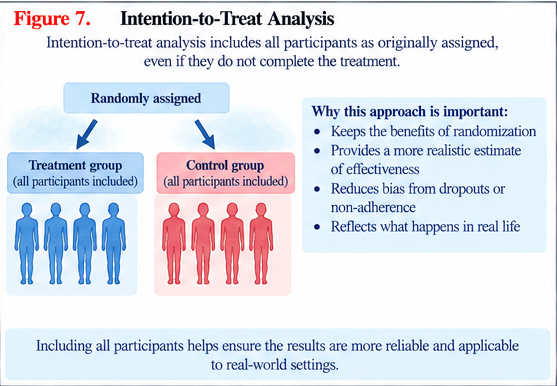
Intention-to-treat analysis generally keeps participants in the groups to which they were originally randomized, even if they did not fully follow the assigned treatment or later crossed over. This helps preserve the fairness created by randomization. [1-8]
It does not solve every problem. Missing data, major protocol violations, and treatment switching can still complicate interpretation. Other analyses may answer different questions, but researchers should explain which analysis was planned and what treatment effect it is intended to estimate. [1-8]
Statistical significance versus clinical importance
Statistical significance asks whether the observed data are sufficiently inconsistent with a specified null hypothesis under the statistical method being used. Clinical importance asks whether the size of the benefit or harm matters to patients. These are different questions. A p value cannot tell us whether patients can feel, see, or benefit meaningfully from the difference. [1-4,8]
Positive, negative, and inconclusive studies
A positive study still needs to be checked for effect size, confidence intervals, multiple testing, missing data, and whether the main endpoint was chosen in advance. A negative study should be examined to see whether it truly rules out an important effect. If the study is too imprecise to answer that question, the correct conclusion may be inconclusive rather than simply 'the treatment does not work.' [1-6]
Why this matters in regenerative medicine
Early stem-cell and extracellular-vesicle trials are often small and may measure many laboratory, imaging, functional, and patient-reported outcomes. This is useful for exploration, but it increases uncertainty and the chance of finding an apparently positive result by chance. Promising exploratory findings deserve further testing; they should not automatically be presented as confirmed effectiveness. [3-6]
Bottom line
Statistics are tools for measuring evidence and uncertainty. When reading a trial, look beyond the words 'significant' and 'not significant.' Ask how large the effect was, how wide the confidence interval was, whether many comparisons were made, how much data were missing, whether subgroup findings were planned, and whether the analysis preserved the original randomized comparison. [1-8]
Questions patients should ask
• How many people were in the study?
• Was the study large enough to answer its main question?
• How large was the treatment effect?
• How wide was the confidence interval?
• Was the result clinically important or only statistically significant?
• Were many outcomes or subgroups tested?
• How much information was missing, and why?
• Were subgroup findings planned in advance?
• Were participants analyzed according to their original randomized groups?