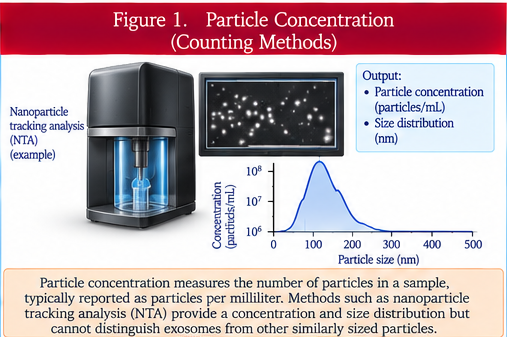
Particle concentration estimates how many detectable particles are present in a defined volume. Common approaches include nanoparticle tracking analysis, tunable resistive-pulse sensing, and related particle-counting technologies. The reported concentration depends on instrument settings, detection thresholds, dilution, refractive properties, background particles, and sample preparation. A particle count does not establish how many detected particles are EVs, how many are a particular EV subtype, or how many carry a proposed active cargo. Concentration therefore needs to be interpreted alongside purity, identity, and orthogonal characterization.
Particle size
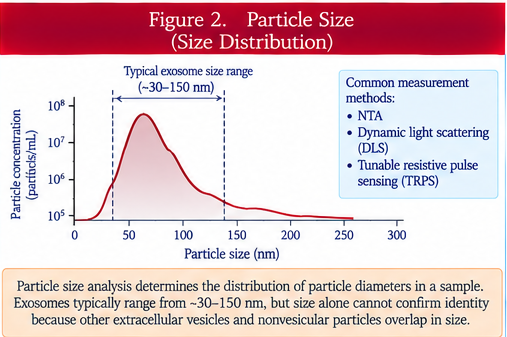
Particle size describes the physical dimensions or size distribution of detected particles. Nanoparticle tracking analysis, dynamic light scattering, resistive-pulse sensing, electron microscopy, and other methods can provide size-related information, but each measures different physical properties and has different biases. EV populations are heterogeneous and overlap in size with lipoproteins, protein aggregates, viruses, and other nanoparticles. Size alone cannot establish exosome identity or biogenesis, and an apparently narrow size distribution does not prove a homogeneous biological population.
Electron microscopy
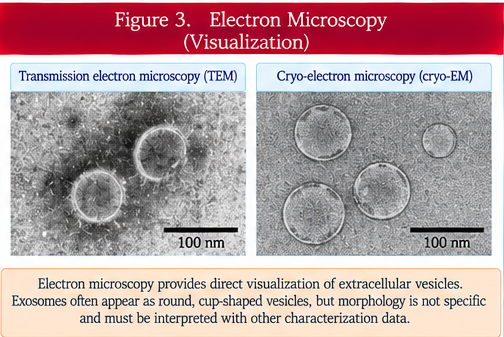
Electron microscopy provides direct visualization of nanoscale structures and can support assessment of particle morphology and approximate dimensions. Transmission electron microscopy, scanning electron microscopy, and cryogenic electron microscopy differ in preparation requirements and image characteristics. Fixation, dehydration, staining, adsorption to grids, vacuum exposure, and freezing can alter appearance. Classical cup-shaped morphology is often a preparation artifact rather than the native shape of an EV. Microscopy therefore supports structural characterization but does not independently establish molecular identity, purity, or function.
Flow cytometry
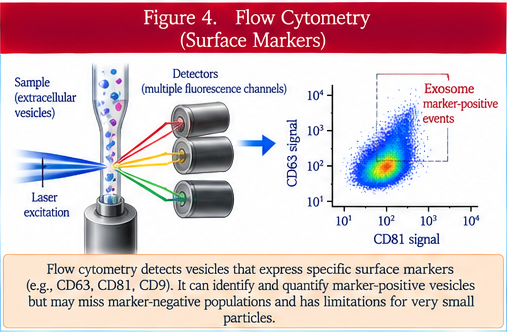
Flow cytometry can characterize individual particles or bead-captured EVs using light scatter and fluorescent labels directed against selected surface molecules. Conventional cytometers were designed for cells and may have difficulty detecting the smallest EVs; high-sensitivity instruments and dedicated small-particle workflows improve resolution but remain sensitive to swarm detection, background fluorescence, coincidence, refractive-index effects, and calibration. Appropriate controls include buffer blanks, reagent controls, detergent sensitivity where relevant, fluorescence-minus-one controls, and standardized reference particles. Marker detection identifies the measured phenotype, not necessarily EV subtype or biogenesis.
Western blotting
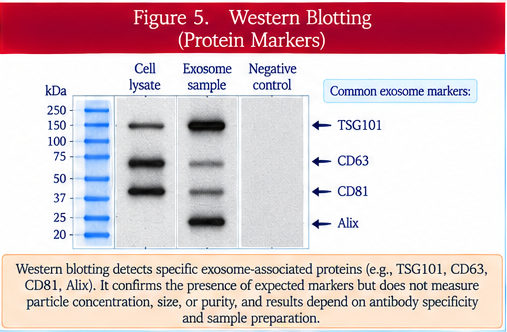
Western blotting detects selected proteins after separation by electrophoresis and antibody-based detection. In EV studies it is commonly used to demonstrate enrichment of EV-associated proteins and depletion or absence of proteins associated with unwanted cellular compartments. Interpretation depends on antibody specificity, sample loading, normalization, exposure, and the biology of the source cells. No single protein is universally present in all EVs or exclusive to one EV subtype. A useful panel therefore includes multiple positive and negative or contaminant-associated markers interpreted in the context of the preparation.
Proteomics
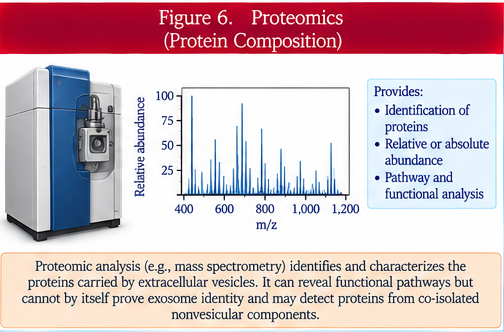
Proteomics uses mass spectrometry or other large-scale approaches to identify and quantify proteins within an EV preparation. It can reveal broad molecular composition, compare manufacturing conditions, identify candidate markers, and generate mechanistic hypotheses. However, proteins detected in a bulk preparation may be intravesicular, membrane-associated, surface-bound, or present in co-isolated nonvesicular material. Sample preparation, dynamic range, database selection, peptide identification thresholds, and normalization affect results. Proteomic abundance is not equivalent to functional potency.
Lipidomics
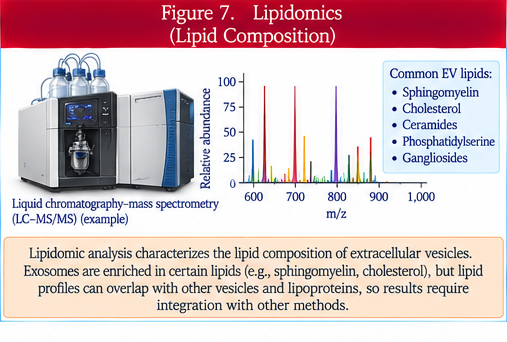
Lipidomics characterizes lipid species and lipid classes associated with an EV preparation. EV membranes can be enriched in cholesterol, sphingolipids, phospholipids, and other lipids depending on source and biogenesis. Lipid profiles can support product characterization and reveal changes caused by culture or processing. Interpretation is complicated by co-isolated lipoproteins, membrane fragments, and other lipid-rich particles. Bulk lipidomics therefore requires strong purity controls and does not show whether a lipid is present in every vesicle or where it is located.
RNA analysis
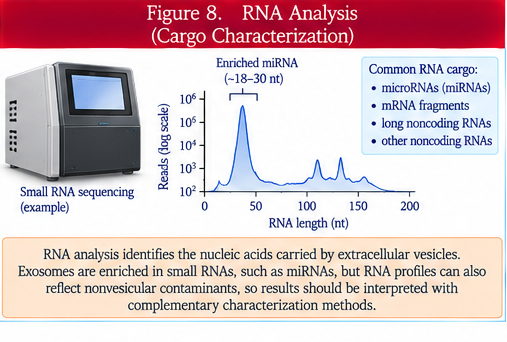
RNA analysis can measure messenger RNA, microRNA, long noncoding RNA, transfer-RNA fragments, and other RNA species associated with EV preparations. Methods include targeted PCR, digital PCR, microarrays, and RNA sequencing. Results are highly sensitive to extraction efficiency, low copy number, normalization strategy, sequencing depth, and extracellular ribonucleoprotein or lipoprotein contamination. RNase-protection and membrane-disruption experiments can help distinguish protected from externally associated RNA. Detection alone does not establish functional delivery or biologically sufficient copy number.
Single-vesicle analysis
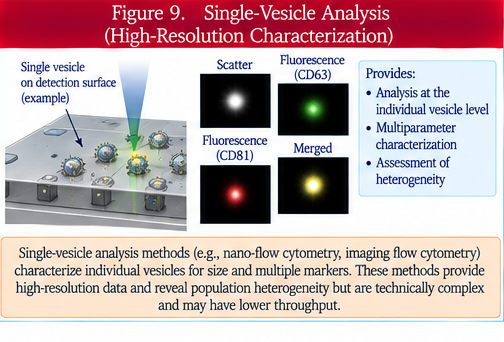
Single-vesicle analysis seeks to measure characteristics of individual extracellular vesicles rather than averaging signals across a bulk population. Approaches include high-sensitivity flow cytometry, imaging-based methods, interferometric platforms, nanoarrays, and other emerging technologies. These methods can reveal heterogeneity in size, surface markers, and molecular cargo that bulk measurements obscure. Challenges include detection sensitivity, calibration, limited multiplexing, sampling bias, false positives, and lack of universal standardization. Single-vesicle data can substantially improve characterization but still require validated controls and careful interpretation.
Clinical takeaway
EV characterization requires multiple complementary methods because particle number, size, morphology, protein markers, molecular composition, and single-vesicle phenotype answer different questions. No single assay proves EV identity, purity, exosome biogenesis, potency, or clinical effectiveness.
Orthogonal characterization
Orthogonal methods measure different physical or biochemical properties. Agreement across independent methods strengthens characterization and reduces the chance that one assay artifact is mistaken for a product attribute.
Positive and negative evidence
Characterization should document features expected in the preparation and assess unwanted cellular or extracellular contaminants. Absence of one contaminant marker does not establish overall purity.
Assay calibration and controls
Reference materials, instrument calibration, blanks, reagent controls, dilution series, spike-recovery studies, and predefined acceptance criteria improve reproducibility. Controls must match the assay and the sample matrix.
Bulk versus single-particle measurements
Bulk assays report averages across the entire preparation and can hide subpopulations. Single-vesicle methods expose heterogeneity but may examine only a subset of particles within the instrument's detection range.
Manufacturing relevance
For a clinical product, characterization assays should be qualified or validated for their intended purpose and linked to lot release, comparability, stability, or process control when appropriate.
Clinical interpretation
A product described as 'characterized exosomes' should specify which assays were performed, what each assay actually demonstrated, the purity and contaminant data, and whether endosomal origin was established rather than inferred.
Knowledge gaps
The field continues to lack universally harmonized reference standards and assay thresholds across platforms. Small-particle detection, absolute counting, molecular localization, and single-vesicle quantification remain technically challenging.
Bottom-line evidence statement
EV characterization is a multidimensional evidence package. Strong characterization combines quantitative particle measurements, structural assessment, molecular markers, composition, contaminant evaluation, and increasingly single-vesicle information, while avoiding claims that exceed what the assays directly demonstrate.
Additional controlled terminology
Particle concentration may be measured by nanoparticle tracking analysis or tunable resistive-pulse sensing, while particle size may also be assessed with dynamic light scattering. Structural imaging includes transmission electron microscopy and cryogenic electron microscopy. Small-particle flow cytometry requires attention to swarm detection, coincidence, refractive index, calibration, a reference particle, fluorescence-minus-one control, and detergent sensitivity. Western blotting can assess a positive marker and negative marker. Proteomics commonly uses mass spectrometry and peptide identification. RNA analysis can use digital PCR, RNA sequencing, and RNase protection. Orthogonal characterization combines independent measurements into a stronger EV characterization package.